How Cleaning Data Drives Australia’s Leading Healthcare Sites
The cleaning industry is undergoing a significant transformation, driven by technological advancements and the increasing adoption of digital tools. As businesses across Australia and the globe rely more heavily on data-driven insights, managers within the cleaning sector are using real-time data to deliver world leading care.
We all know the adage, you can’t manage what you can’t measure and up until the last 10 years the best way to measure cleaners was with paper tick sheets. However, these were never effective, and it was impossible to know confidently what was and wasn’t cleaned, let alone understand the nuances around the challenges faced by your cleaning team.
Now, it’s easy to see not only what has and hasn’t been cleaned, but also how long different cleans take, what areas need additional cleans scheduled and which of your team needs additional training. Leading Healthcare sites are now learning about their cleaning operations in a way that allows them to deliver more with less, ensure their team work efficiently and allow forecasting like never before.
Below are just some of the Metrics Leading Healthcare Sites rely on each day to manage their cleaning operations.
What’s My REAL Daily Completion Percentage ?
Paper Tick Sheets created a false sense of confidence around what a site believes has been completed during a day. It is common practice for cleaners to tick all areas on a paper tick sheet so they can keep their head down and go about their days without causing a scene. Often there is a strong feeling of fear that they will be punished or penalised for not completing areas that they couldn’t get to for whatever reason.
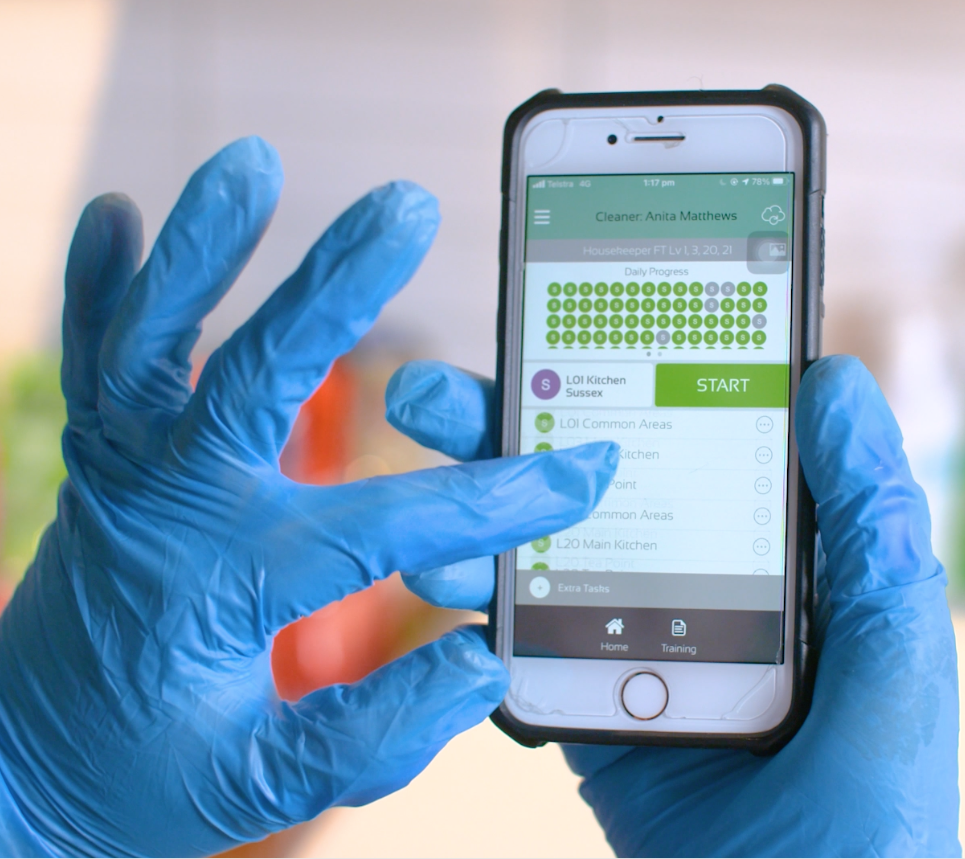
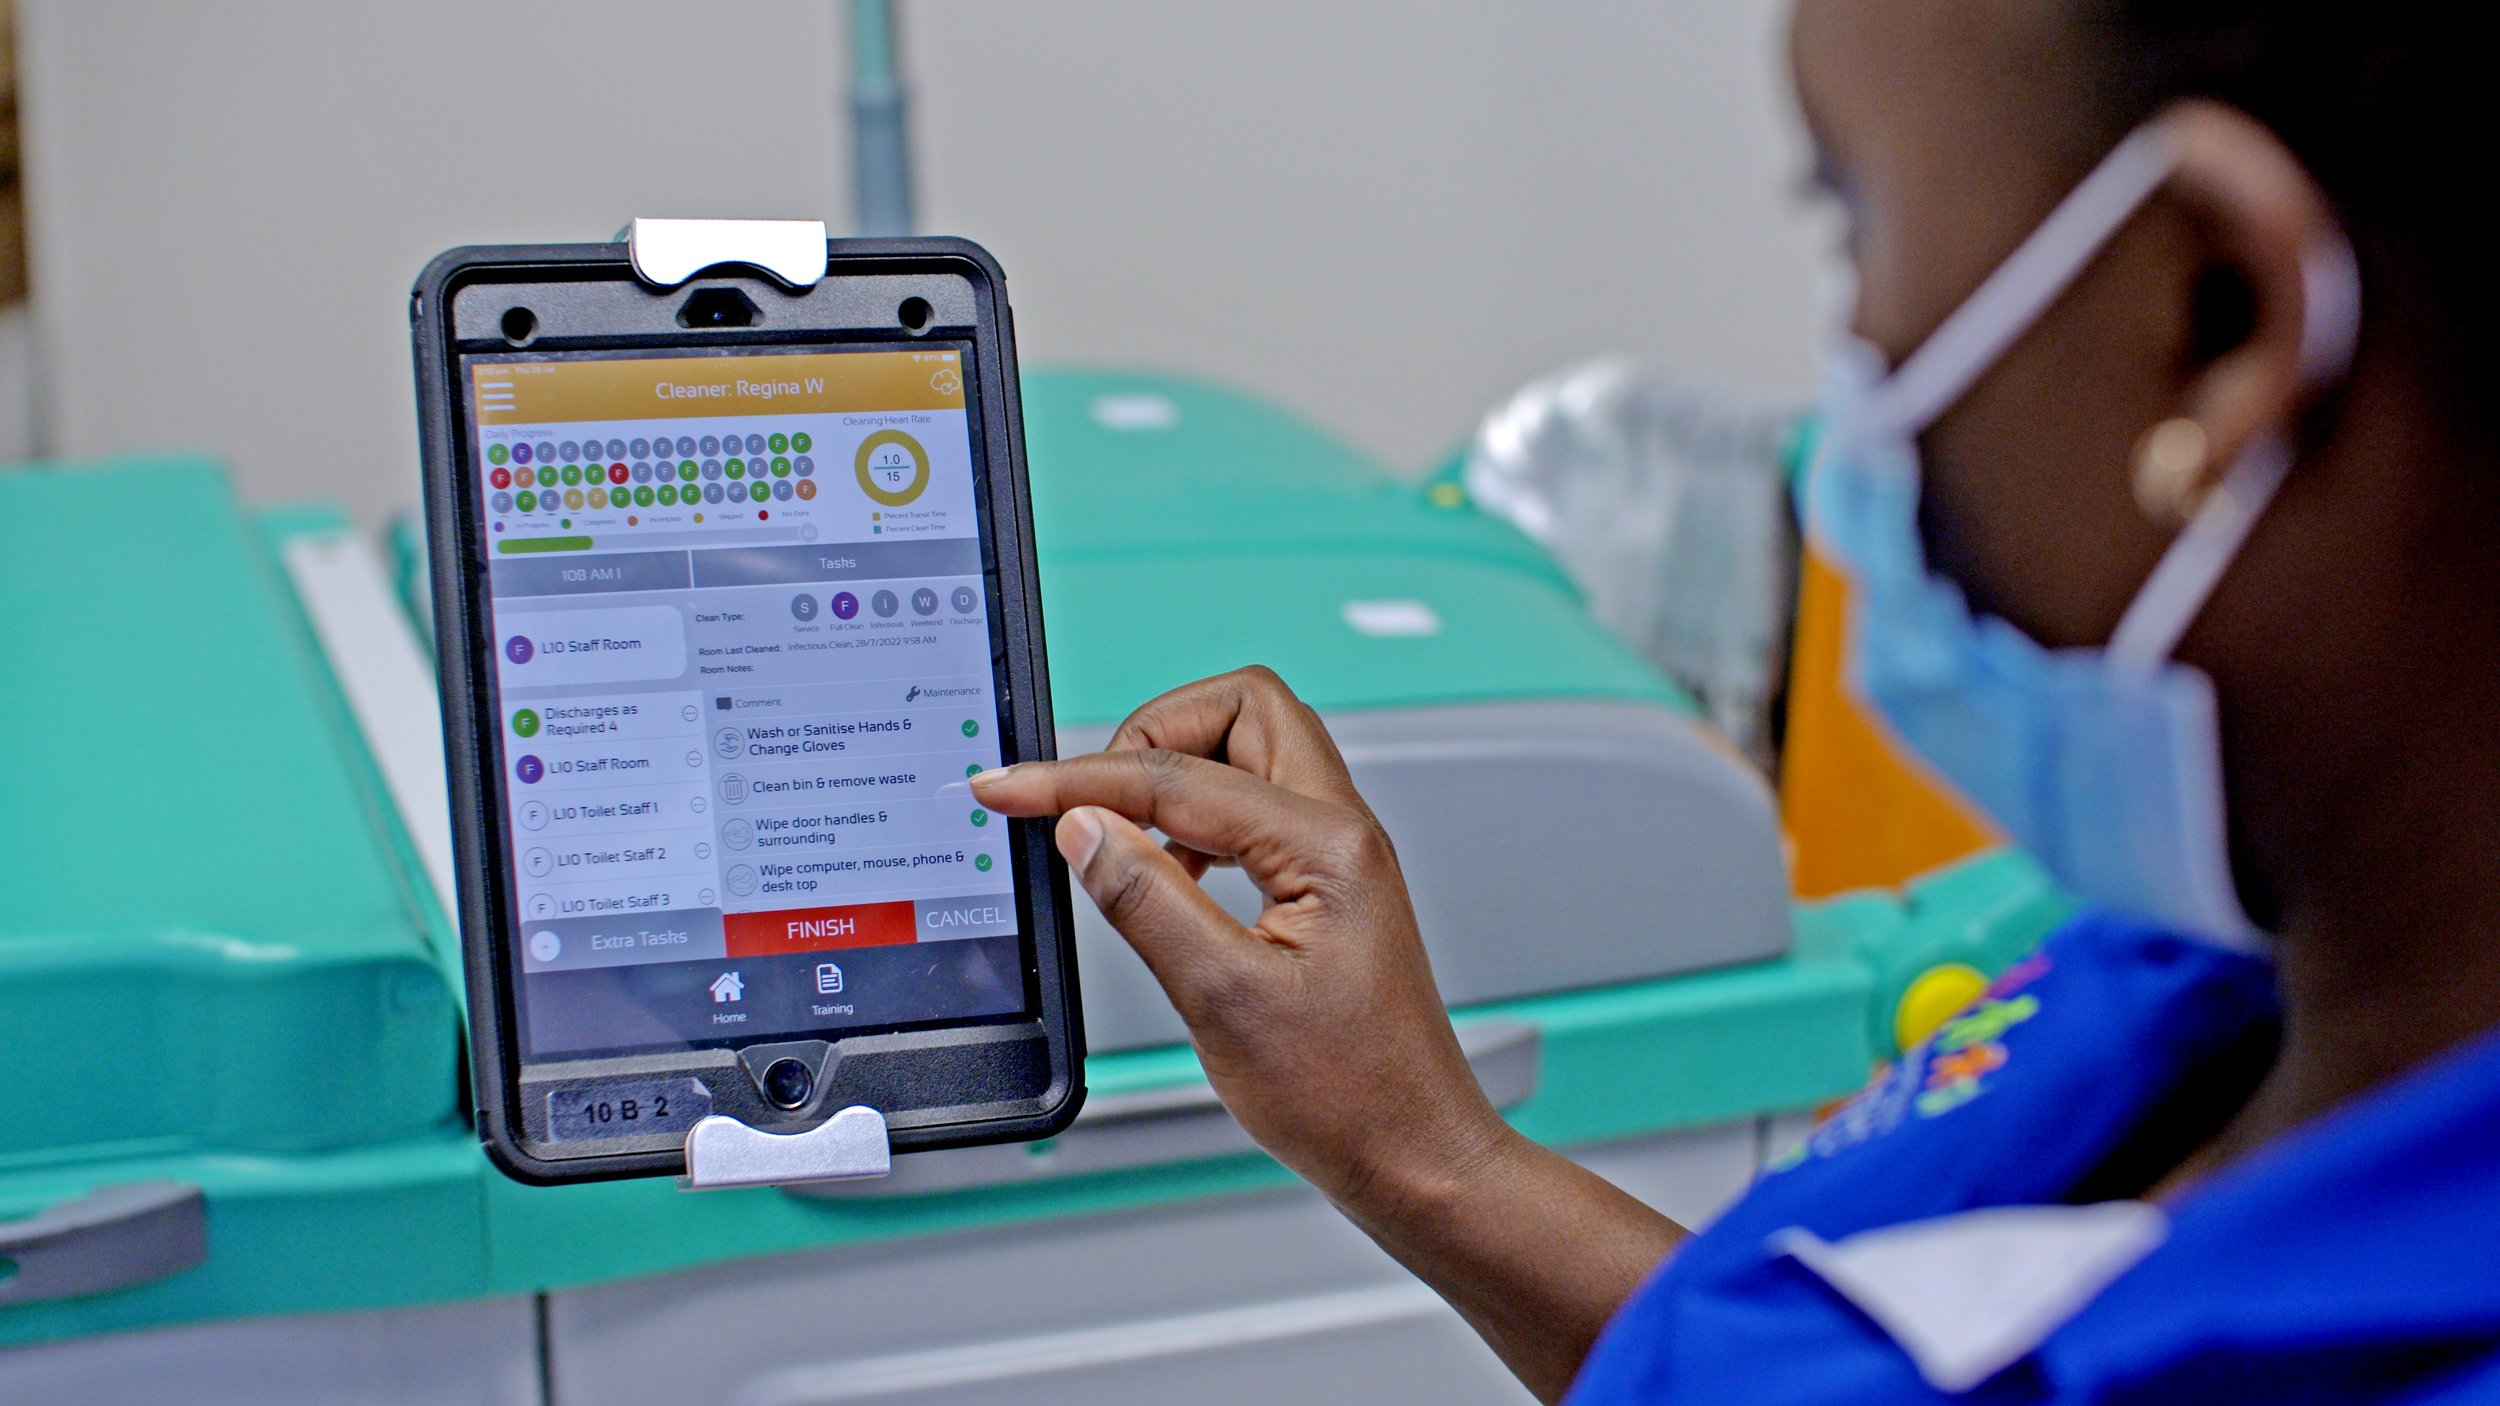
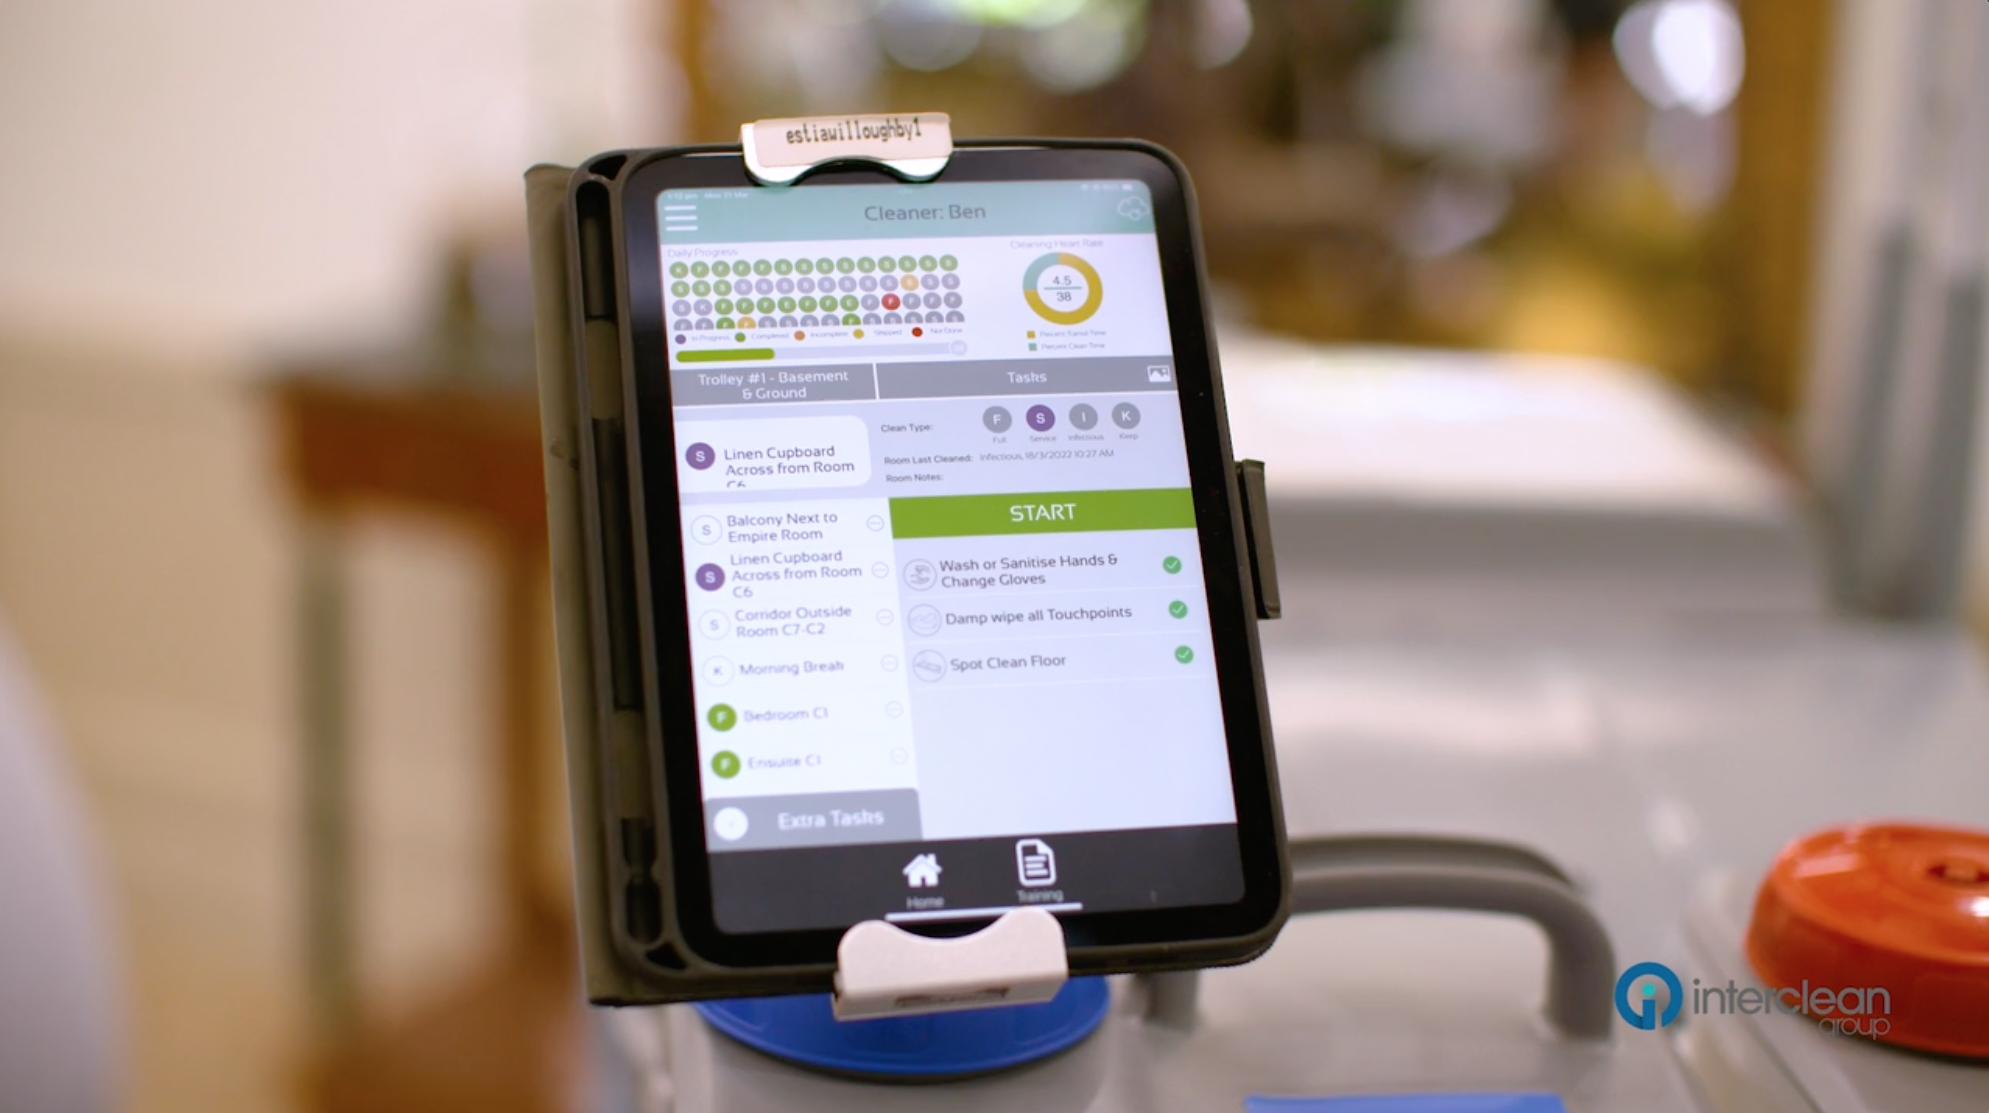
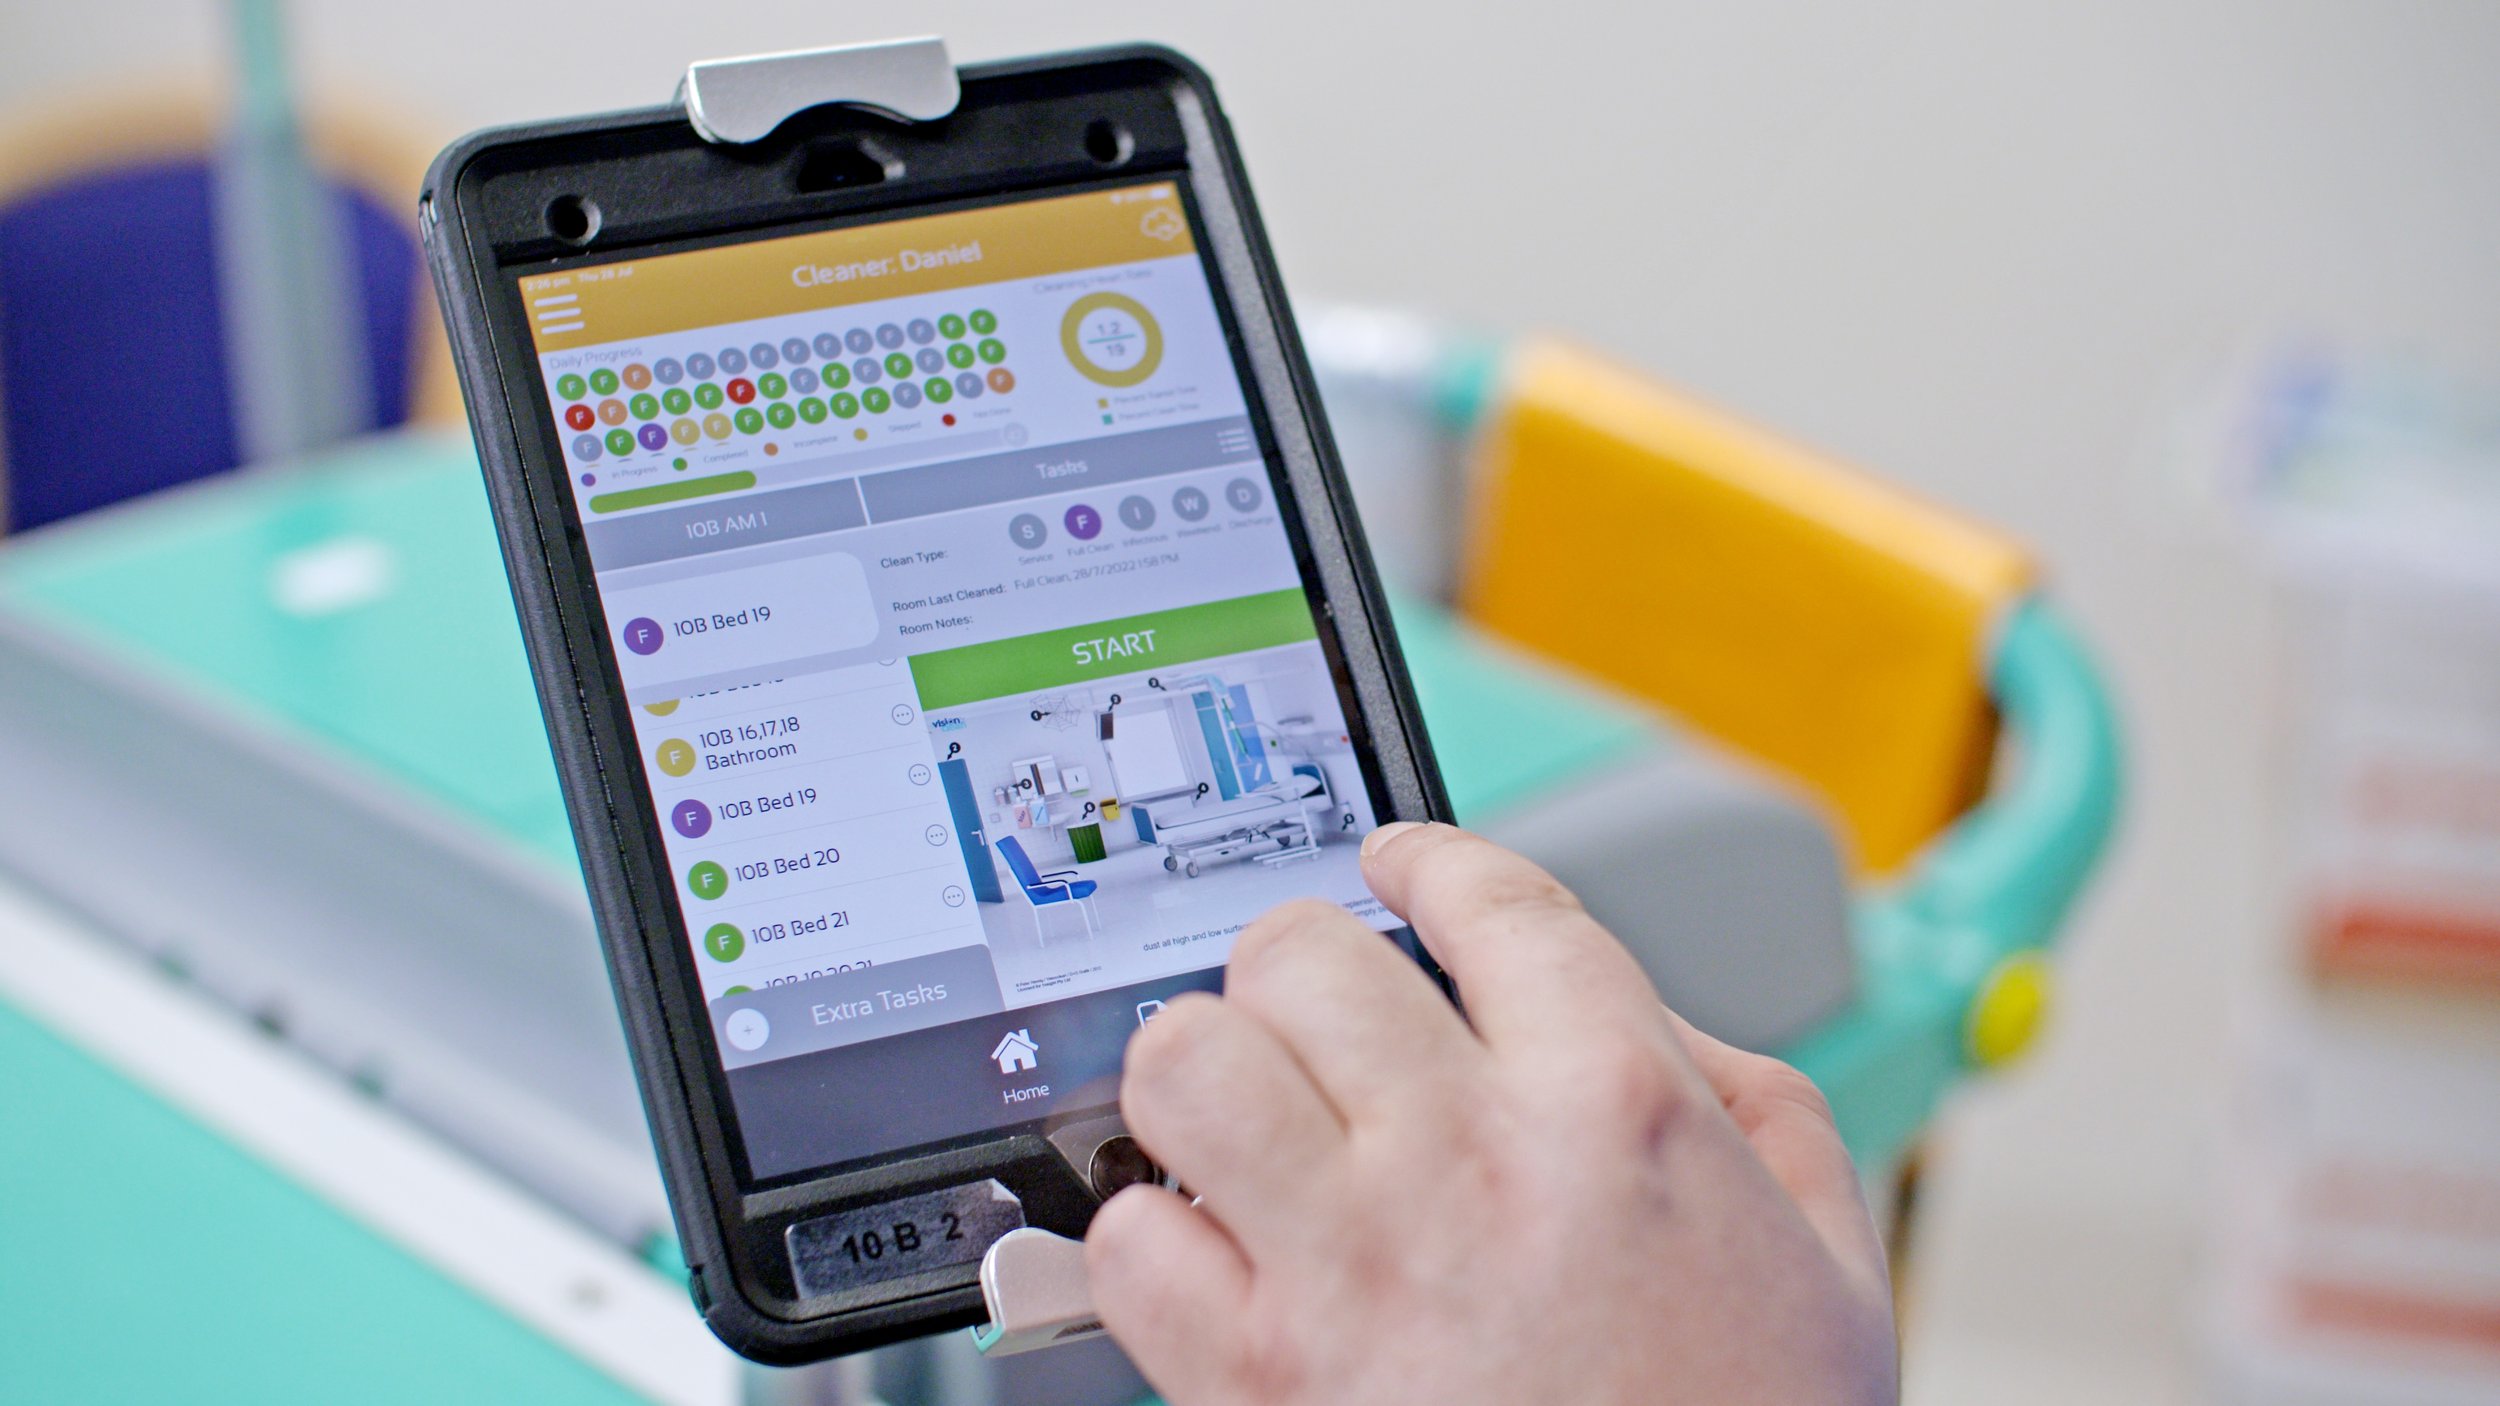
Using a digital cleaning run sheet that manages their time throughout the day means that managers can see what areas are actually cleaned and when, giving an honest account of the days activities. Once we know what actually happens, we can start working on how to improve. If we think everything is perfect, then there’s no room for continuous improvement and nothing will change.
Do My Cleaning Hours Fit On My Rosters ?
Again, Traditional Time in Motion studies used to be the best tool for working out cleaning schedules and rosters. But in today’s age they fall short on so many levels. We all know a cleaner doesn’t clean the same way when someone is watching them with a stop watch compared to what they do at 2pm in the afternoon and we also know that a large part of our cleaners day is spent on reactive jobs and changing clean type requirements.
Now, with iClean you are able to use your real actual clean times over 100’s of cleans in the exact areas you clean to set your cleaning schedules, including transit time and capacity for additional duties to create and justify your rosters.
What Area’s Were Not Cleaned ?
Whether you manage large cleaning teams, or simply juggle a number of duties in your portfolio, you don’t have time to worry about every area on every cleaners run sheet. You need to manage the areas that haven’t been cleaned, because that’s where your risks are.
Digital Cleaning Data allows you to focus your energy on the things that need it, by running simple exception reports that allow you to respond to all of the anomalies of the day.
You now have the ability to make better decisions about your site, because you have real data about your facility, your cleaners, your challenges and your opportunities.
Embracing digital metrics is crucial for managers in the cleaning industry to optimise their operations. By focusing on key performance indicators such as time tracking, task completion rates, customer satisfaction, and resource utilisation, managers can make data-driven decisions that enhance service quality and drive success.


